Creating Custom Metrics with CloudWatch AWS

Infrastructure monitoring is one of the most important aspects an organisation can implement to determine the health status of its IT resources. Whether an organisation is inclined towards a reactive or proactive approach of its On-premise or Cloud environment, it’s important to have a monitoring strategy in place to drive business value.
In today’s evolving environments, organisations should be tailored towards a proactive monitoring approach of its resources instead of a reactive approach. Amazon CloudWatch provides a way to achieve proactive monitoring irrespective of the type of environment.
This article showcases the set-up and use of Amazon Web services CloudWatch to automate proactive monitoring of IT resources.
Requirements;
1. An Amazon Web Service Account
2. An understanding of Amazon Web Services, Identity Access Management(IAM), Elastic Compute Cloud Service (EC2) and Security groups
3. An understanding of SSH (Windows users can use Putty access)
4. An understanding of Linux permissions and its File System
A metric represents a time-ordered set of data points that are published to CloudWatch. Types of Metrics include;
Host level Metrics;
• CPU
• Network
• Disk Usage (I/O)
• Status Checks
Custom Metrics: Custom metrics are can be presented in intervals of 1 Minute (Detailed Monitoring) or 5 Minutes (Standard Monitoring)
• Ram Utilization
• Storage of Virtual Disks
Let’s proceed with how we can achieve the task at hand;
Step 1: logging into AWS and creation of IAM policies
https://signin.aws.amazon.com/

Create permissions with IAM to allow the EC2 instance communicate with Cloud Watch.
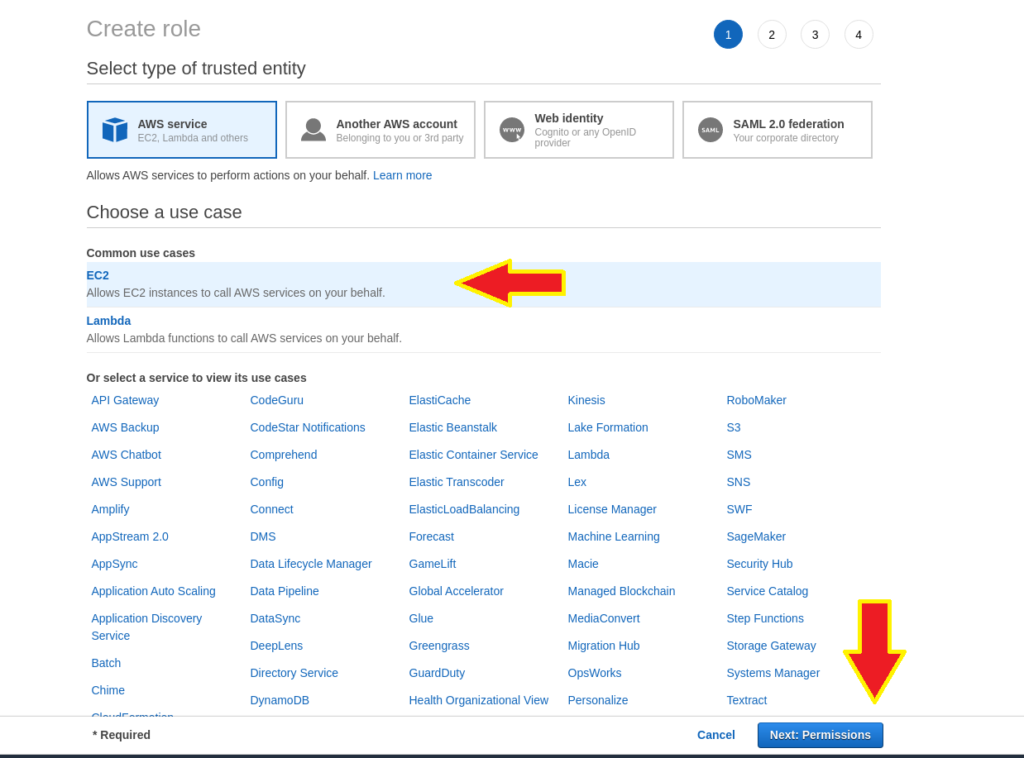
Navigate to the IAM section on the AWS panel and select “ROLES” to create a role

Select EC2 tab and click Next
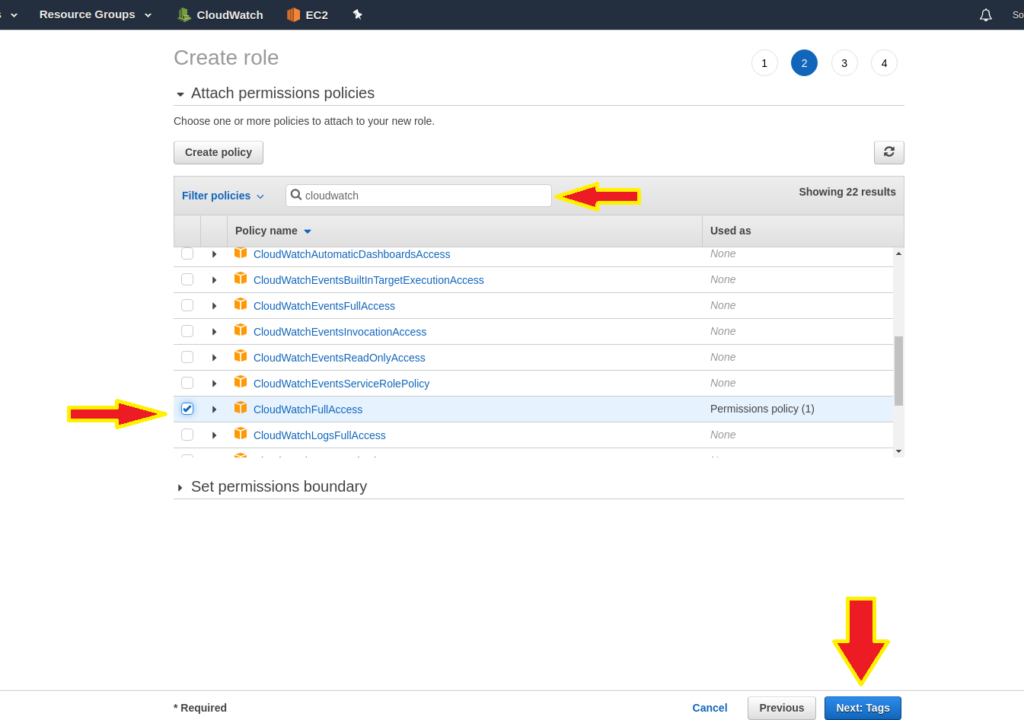
Search for “CloudWatchFullAccess” policy to attach to the New role
Note: This article is specific to the "FULLAccess" Role but more roles are available should you want to explore the flexibility of IAM policies.
Add a new Tag to the role created and click review. (Tags are a great way organize resources in the AWS)

Set a name for the ROLE and click “Create Role” Button to create the ROLE

Now that the Role has been created ,proceed with creating an EC2 Instance
Step 2: Provisioning Ec2 instance
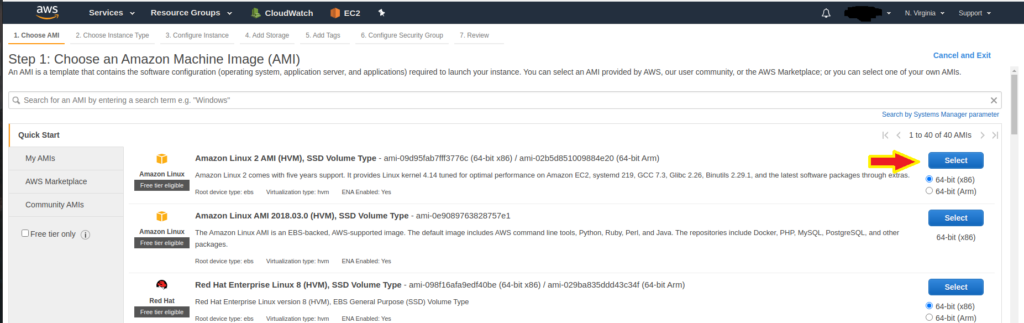
To Create an EC2 Instance, Navigate to EC2 Dashboard and Launch an Instance

For this exercise we shall use the Amazon Linux 2 AMI
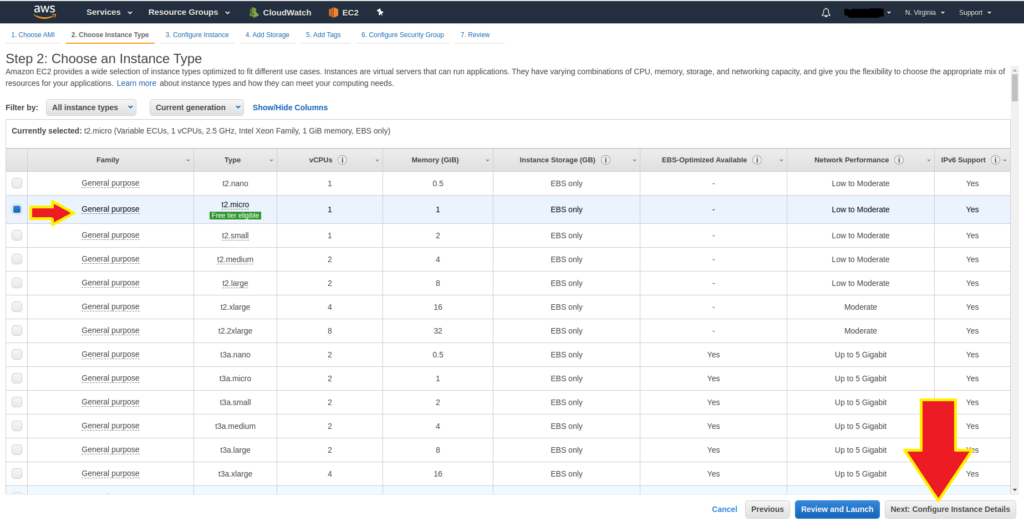
Choose the T2 family for this installation. Depending on organisations needs, other instance families are available
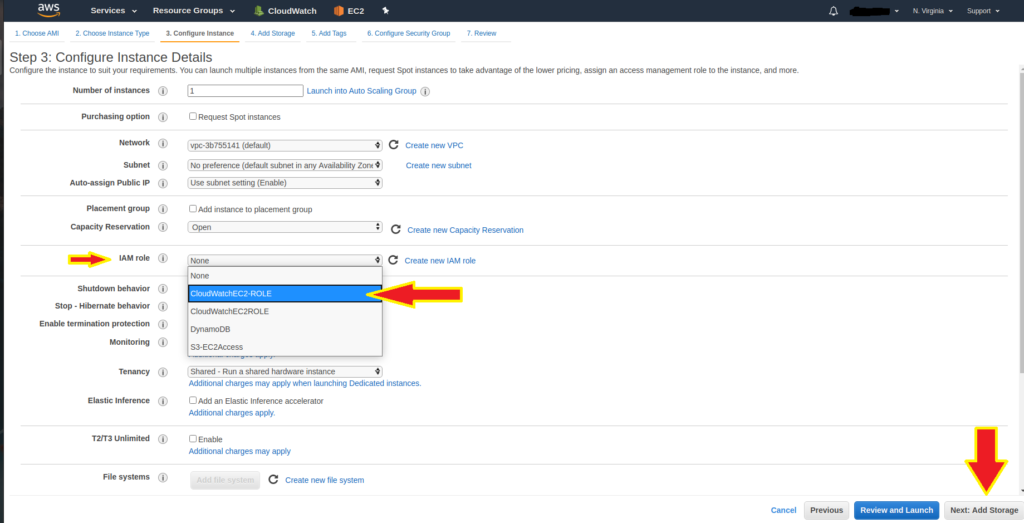
In the Configuration section, leave all fields set to default except the “IAM Role” field where we attach the previously created Role. This allows EC2 to communicate with CloudWatch
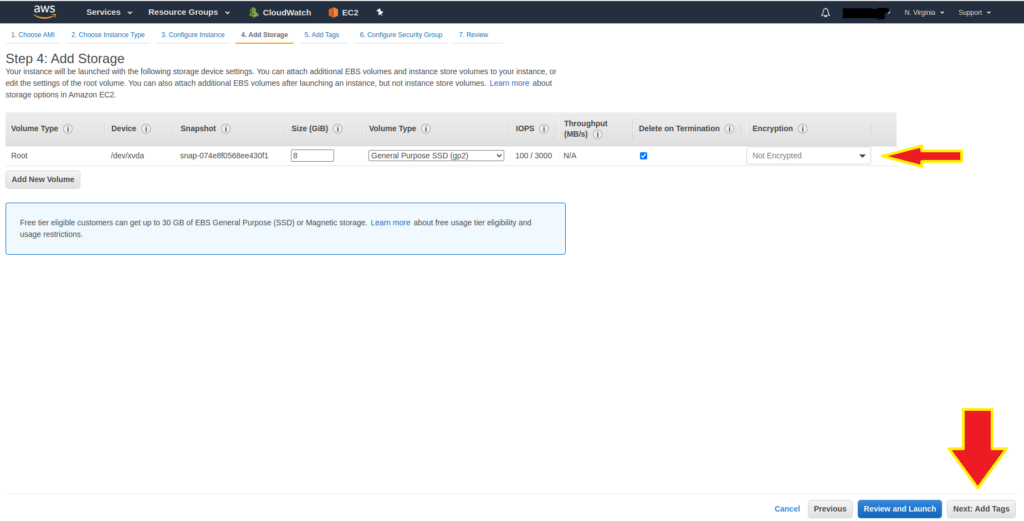
Next is to configure storage for the EC2 instance. Since this is not a production workload, large Storage requirements are not necessary.
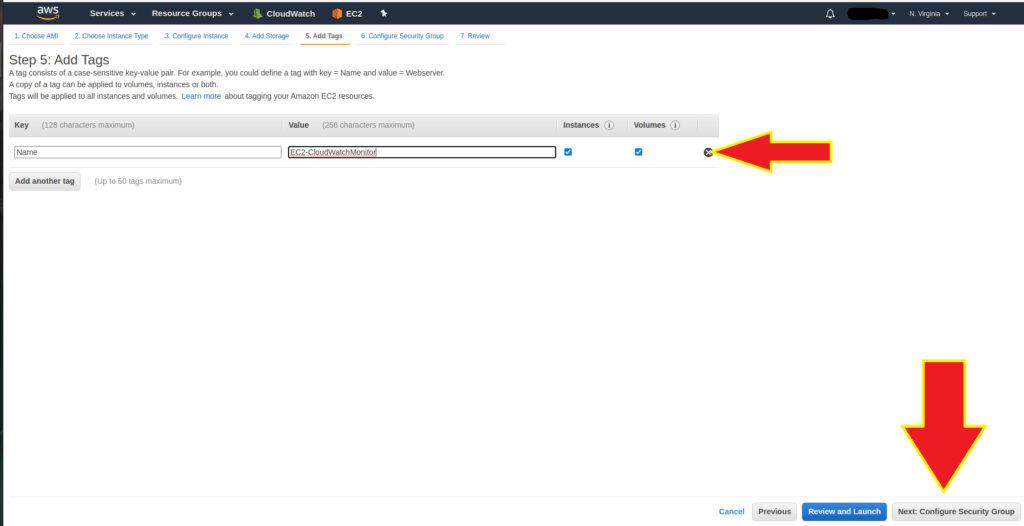
Add Tags to our instance for easy identification of this resource
Security Groups are a virtual firewalls for the instance. Create a new Security Group “CloudWatch-SecurityGroup” and add Rules to allow access into the instance from the internet using SSH
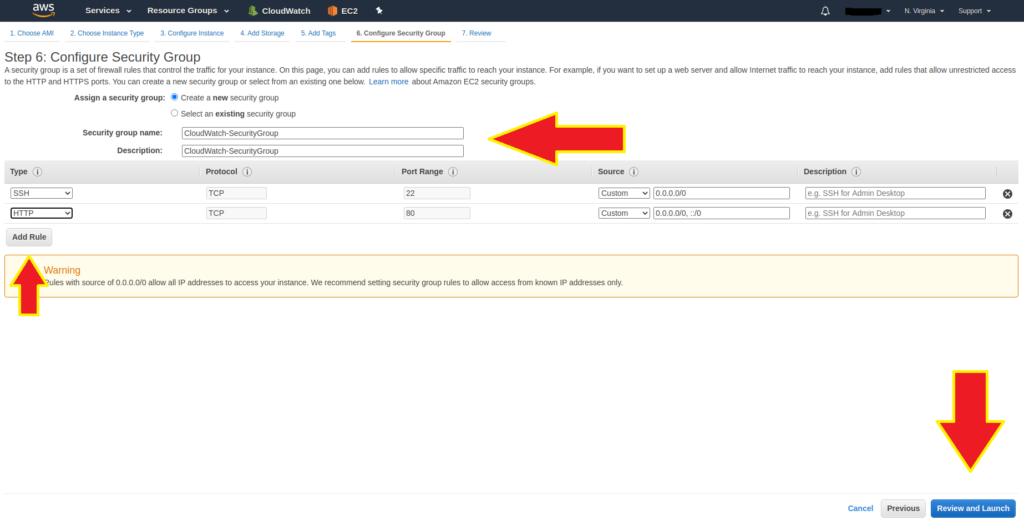
For this exercise, only two Rules are required ;
SSH (Port 22) and HTTP (Port 80) with a source as 0.0.0.0.0(Access from the internet)
Next we can review all instance configurations to ensure the correct parameters have been implemented before launching the instance.

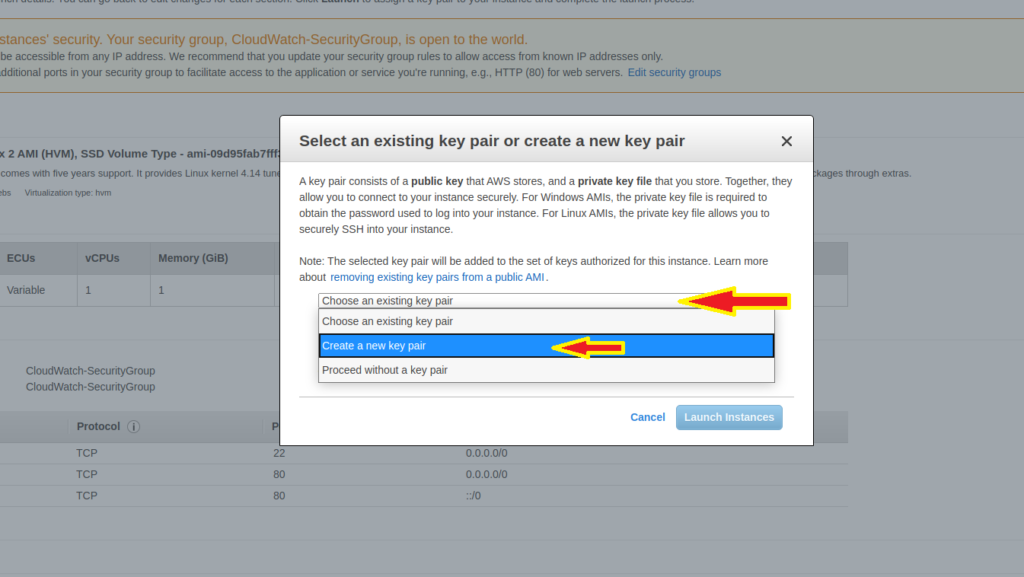
Before launching the instance, Create a key pair to enable us securely access the instance instead of using passwords
Download your Key pair to a preferred location on your local machine. In this scenario, I downloaded it to the Desktop of my local machine
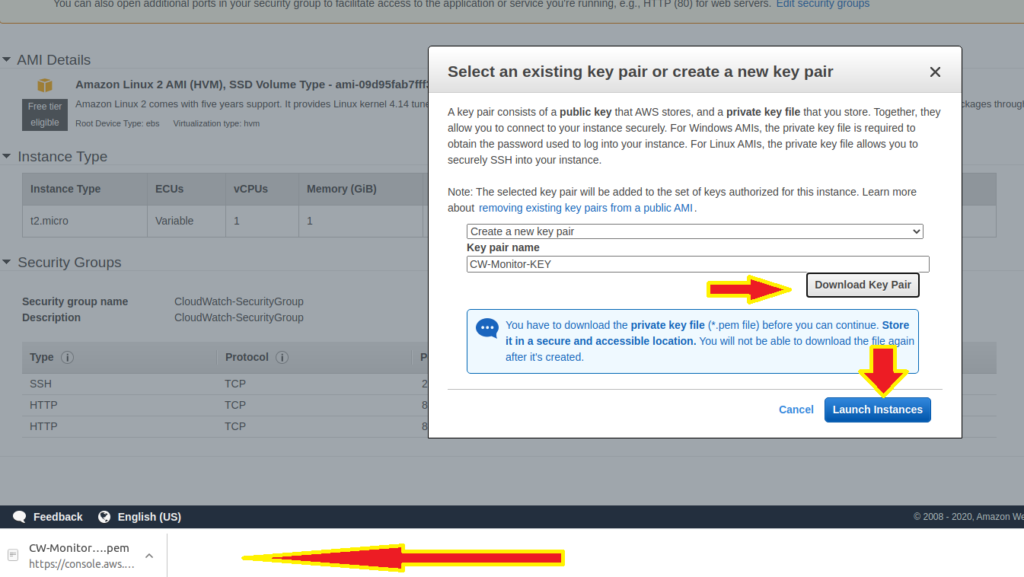
Once Downloaded, Our EC2 Instance Launch process can proceed and is viewable on the EC2 dashboard once complete.
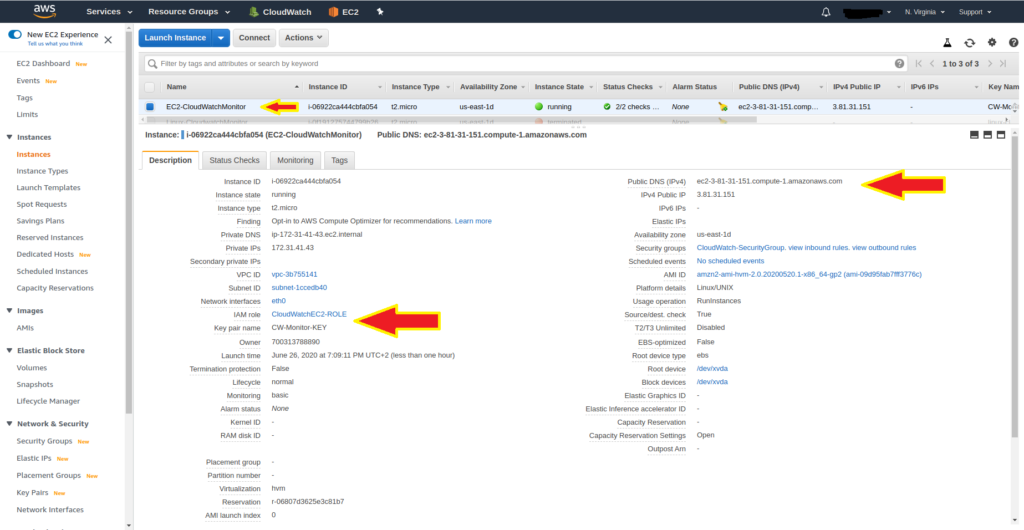
With the Instance launched successfully, we can confirm that it has a Public DNS and is attached to our created ROLE.
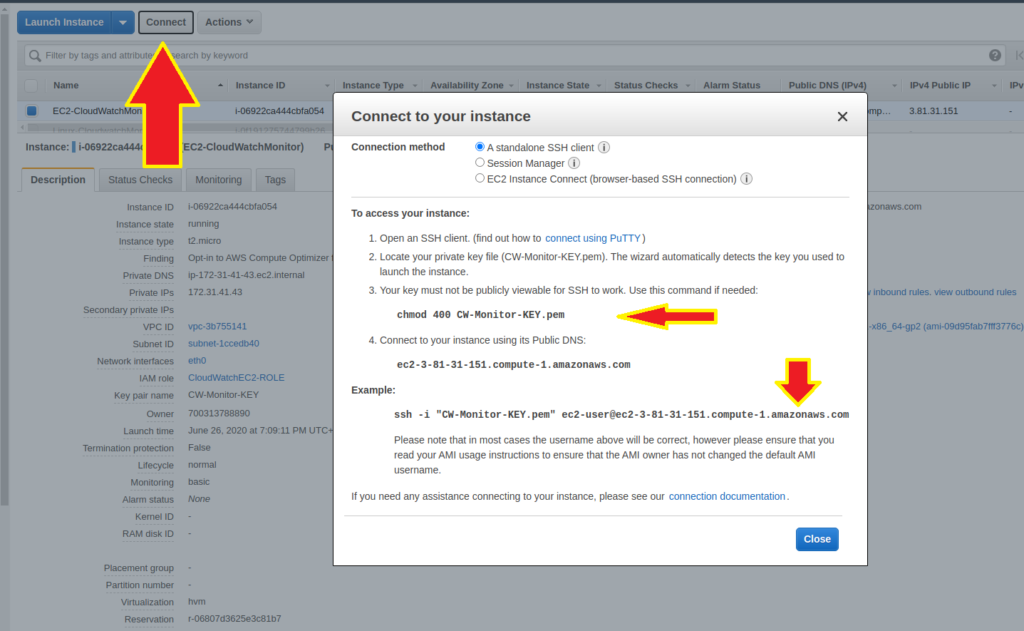
Next is to remotely connect to the instance to execute scripts to monitor the instance. We require the connection string which can be accessed in the EC2 dashboard as seen below
ssh –i “CW-Monitor.KEY.pem” ec2-user@ec2-3-81-31-151.compute-1.amazon.com
Step3: SSH into EC2 Instance from Terminal
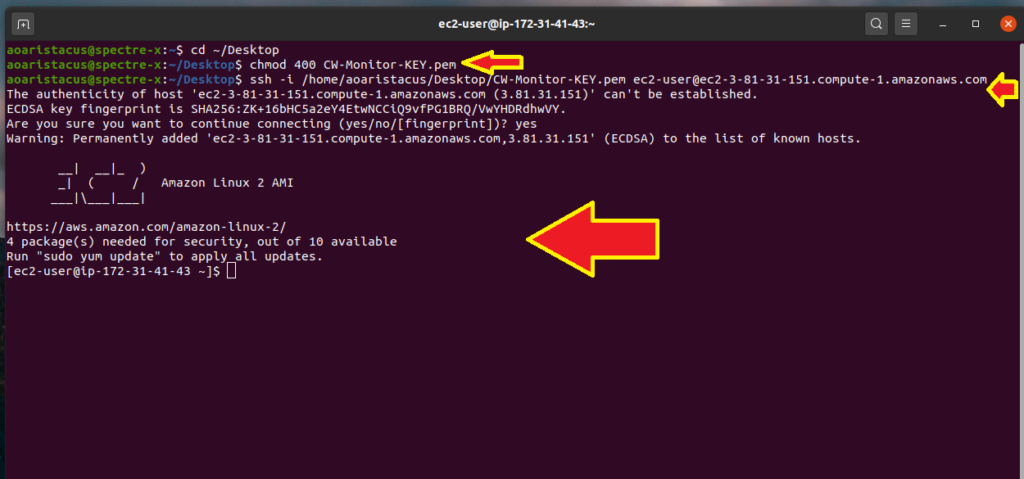
Before we can remotely connect to the instance using SSH, we must use the CHMOD command to make sure that the private key is not publicly viewable. It gives the user read permissions and removes all other permissions.
In this case the key is located on the desktop
“chmod 400 CW-Monitor-KEY.pem”
Connect to the EC2 instance using the connection string
ssh –i “CW-Monitor.KEY.pem” ec2-user@ec2-3-81-31-151.compute-1.amazon.com
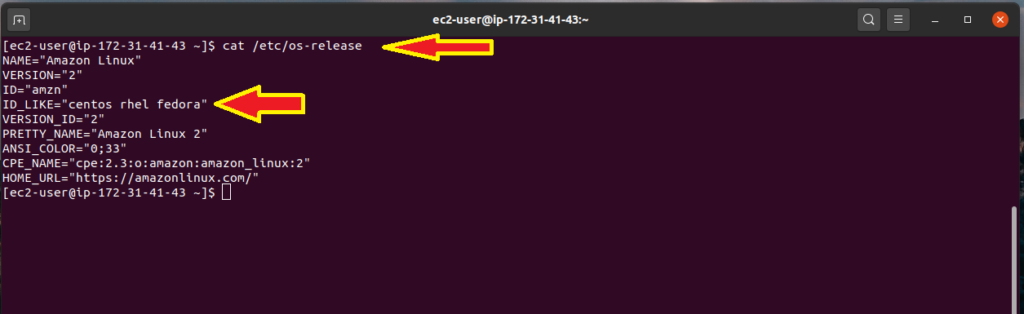
Once connected to the instance, we might need to know what type of linux distribution is installed. This is only necessary if you are not aware of what distro you are running. Exectung a “cat /etc/os-release” will provide detailed information of the distro and save time when running package managers on the instance.
Users running Ubuntu based instances on AWS lightsail /EC2 can use the advanced package manager APT -GET
In this case, we can identify that the instance is an RPM-based distribution and therefore will be using “Yellow dog Updater, Modified(YUM)” on this instance.
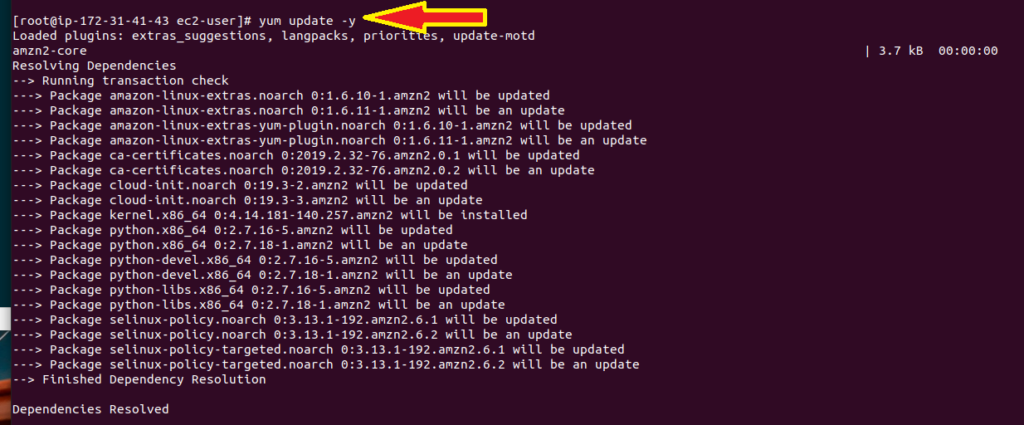
As always with Linux, run an update to ensure you have the latest updates.
Installing the Monitoring scripts:
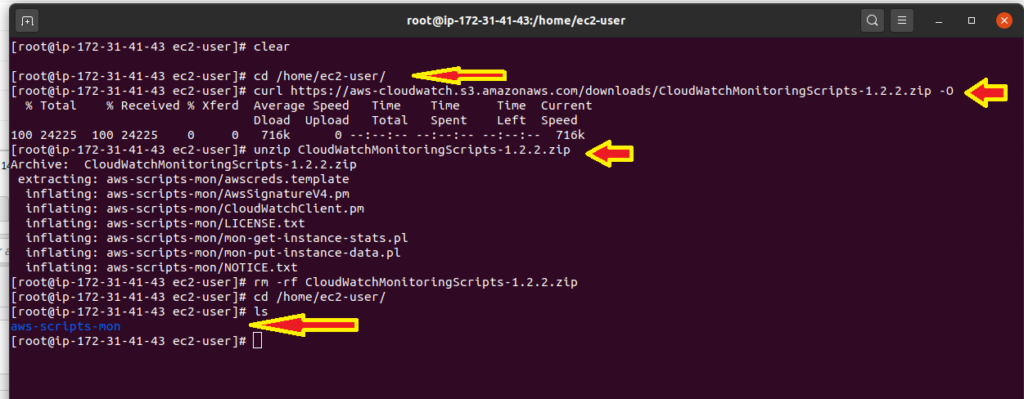
Change to a proffered directory on the instance and download Cloudwatch monitoring scripts using the “CURL” command
Curl http://aws-cloudwatch.s3.amazonaws.com/downloads/CloudWatchMonitoringScripts-1.2.2.zip -o
UNZIP the downloaded files ---“unzip CloudWatchMonitoringScripts-1.2.2.zip”
Execute the mon-put-instance-data.pl scripts which collects memory, swap and disk space utilization data on the current system. It makes remote calls to Cloudwatch to report the collected data as custom metrics.
There are various scripts that can be executed but in this case we shall focus on –mem-util, --mem-used and –mem-avail metrics.
A reference Id is populated showing the success of reported metrics to cloud watch.
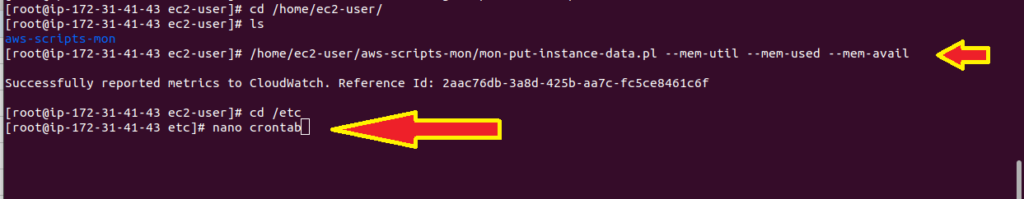
In order to automate reporting of metrics, execute a script in the crontab file in the /etc directory
NOTE: CRON is a time based job scheduler in linux/Unix based operating systems.
*/1**** root /home/ec2-user/aws-scripts-mon/mon-put-instance-data.pl –mem-util –mem-used –mem-avail

Save the file and CloudWatch will start collecting metrics from the EC2 instance every minute
Cloudwatch Metrics Verification
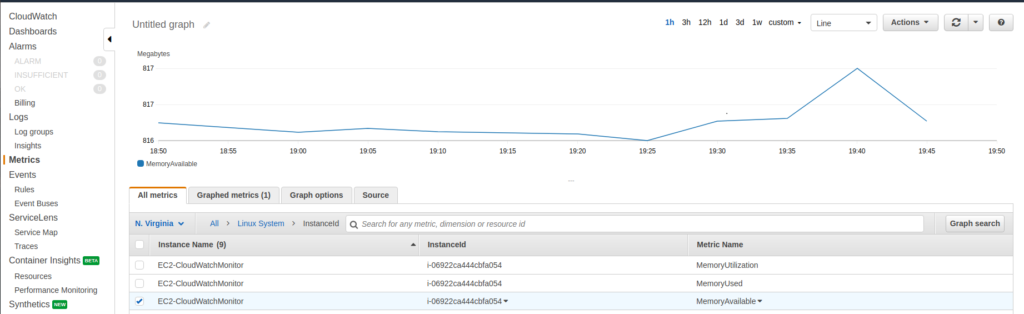
Navigate to the CloudWatch dashboard and select the Metrics tab to view the metrics. Metrics will be populated under the custom Namespace tab

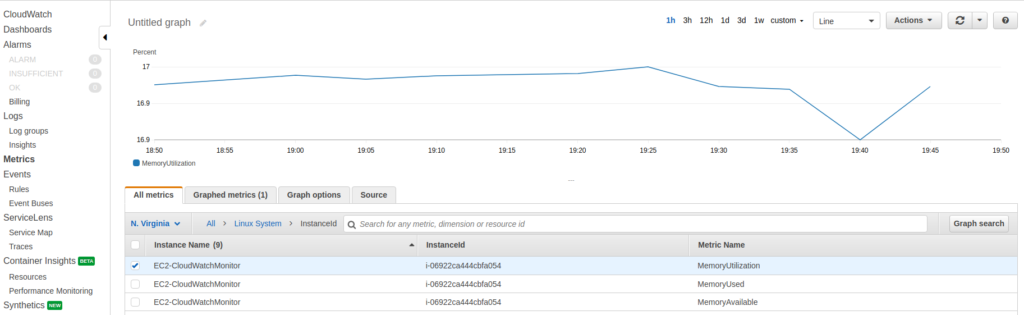
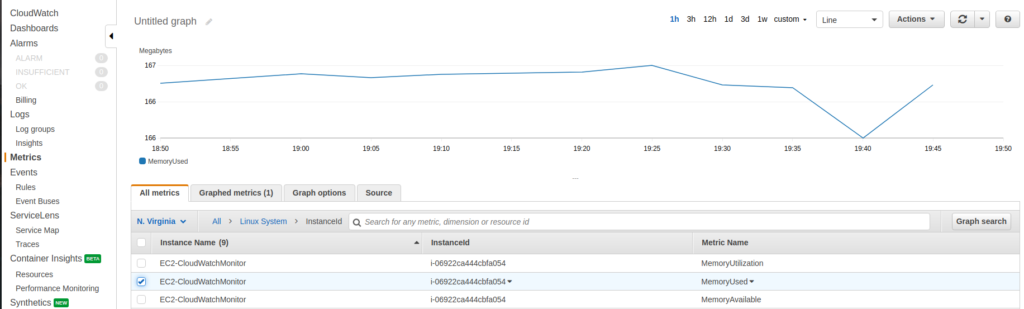
The three Metrics we populated are now visible under the “LINUX SYSTEM” namespace
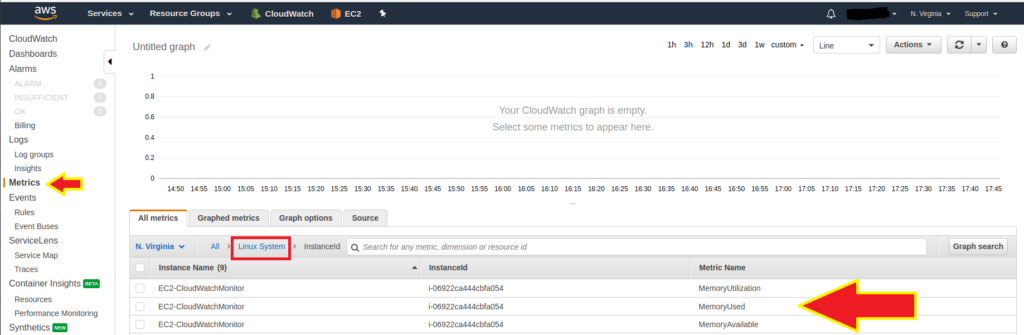
Each custom metrics is now visible in CloudWatch
I hope you enjoyed the read!